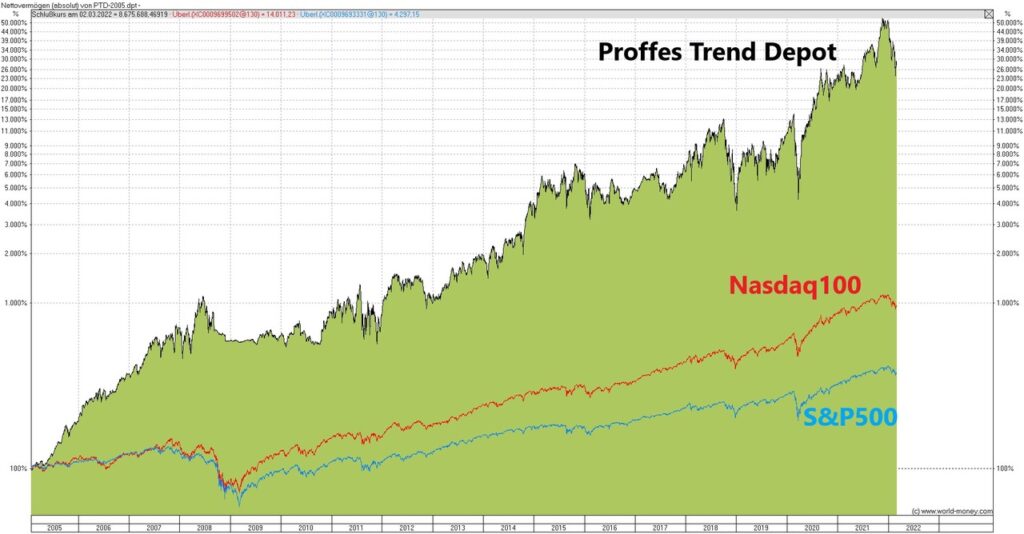
Proffes Trendfolge System®
Michael’s Trendsetter Strategy is a 3-step analysis of the markets, the stocks in those markets, and the way those stocks are viewed by investors.
The fundamental goal of the Trendsetter Strategy is to have a simple, stable system to find great stocks and consistently build steady returns without having to rebuild the system every time the markets shifts, or something happens to the economy.
Only shares that pass all 3 of these filters are considered as candidates for the Proffe’s Fund, and each portfolio stock is continually monitored to make sure that it continues to pass all 3 filters. Once it falls off trend, it is replaced by a stock that is on trend. This is what allows the portfolio to continue to grow and achieve its market-beating gains with relative safety and ease.
This is what makes the Trendsetter Strategy completely unique in the markets today, and its 25-year record of outsized performance proves how effective it is.
1. Fundamental Analysis
He screens stocks for their fundamental, long-term viability. A company that has built a strong foundation for growth is likely to continue its growth, come what may.
Some key indicators he looks at:
- Turnover – a positive development is a plus
- EBITDA, or Earnings Before Interest, Taxes, Depreciation and Amortization – a strong record of growth is key
- Stock Yield – a stable, growing and consistent dividend is favored
- Positive Working Capital – whether a company has enough cash on hand to manage its debt obligations; the more the better.
2. Technical Analysis
Here, Michael digs into how these stocks look from a technical perspective. Stocks may be fundamentally sound but are not technically attractive. Both criteria have to be met for the Trendsetter Strategy.
Michael drills down into specific indicators:
- MACD, or Moving Average Convergence/Divergence – a trend-following momentum indicator that shows the relationship between two moving averages of prices. Positive momentum is key
- MOM – a momentum indicator that measures the velocity of price change instead of looking only at the price levels. A reading above 0 is crucial.
- RSI, or Relative Strength Index – compares the magnitude of recent gains and losses over a given time period to measure speed and change of price movements of a stock. It’s used to identify overbought or oversold conditions in a stock.
- Williams %R – the current closing price of a stock in relation to the high and low of the past x number of days.
3. Behavioral Finance
This looks at the behavioral and psychological aspects of the markets in relation to the economics and finance aspects of the market.